The Legend Add method adds another item to an existing legend.
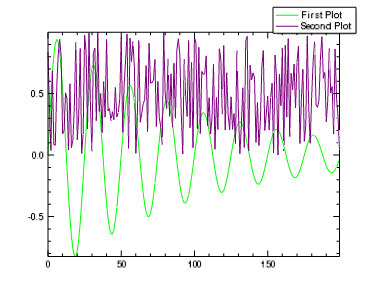
plot = PLOT(/TEST, COLOR='lime')
l = LEGEND(LABEL='First Plot')
plot2 = PLOT(RANDOMU(seed,200), COLOR='purple', /OVERPLOT)
l.add, plot2, LABEL='Second Plot'
legend.Add, TARGET [, Properties=variable]
One or more graphic items to be added to the existing legend.
None
The following properties will be passed down to the newly-added legend item.
Set this property equal to a string specifying the IDL or system font. The default value is “Helvetica”.
Set this property equal to an integer specifying the font size. The default value is 16 points.
A string or integer containing the font style. Allowed values are:
|
Integer |
String |
Resulting Style |
|---|---|---|
|
0 |
"Normal" or "rm" |
Default (roman) |
|
1 |
"Bold" or "bf" |
Bold |
|
2 |
"Italic" or "it" |
Italic |
|
3 |
"Bold italic" or "bi" |
Bold italic |
Set this property to a string giving the label for the legend item. If this property is set then the default label will not be used. Set this property to an empty string to go back to using the default label.
You can add Greek letters and mathematical symbols using a TeX-like syntax. These symbols need to be enclosed within a pair of "$" characters. See Adding Mathematical Symbols and Greek Letters to the Text String for details on the available symbols.
The angle of the sample line or arrow, in degrees. The default value is zero, which gives a horizontal line for line plots, and a right-pointing arrow for vector plots.
For legend items for vector plots, set this property to either a case-insensitive string or a floating-point number giving the length of the sample vector. Possible values are:
The arrow displayed in the legend is scaled to match the chosen length, relative to the maximum magnitude of the vector plot. This property is only used for legend items for vector plots, and is ignored for all other legend items.
Note: If the LABEL property is set, then the SAMPLE_MAGNITUDE will still be used to scale the length of the sample arrow, but will not be used to label the legend item. For example, if your vector data was in "miles per hour" but you wanted to display the length in "km/hr", you might set the SAMPLE_MAGNITUDE to 62, but then set the LABEL to "100 km/hr".
The width of the line sample, in normalized units. The default value is 0.15.
Set this property to a string or RGB vector that specifies the color of the text.
Set this property to a string giving the units for the vector plot. This string will then be appended to the sample magnitude label in the legend item. If the LABEL property is set then this property is ignored. This property is only used for legend items for vector plots, and is ignored for all other legend items.
You can add Greek letters and mathematical symbols using a TeX-like syntax. These symbols need to be enclosed within a pair of "$" characters. See Adding Mathematical Symbols and Greek Letters to the Text String for details on the available symbols.
|
8.0 |
Introduced |
| 8.2 | Added Legend Item properties. |